
Figure 4.
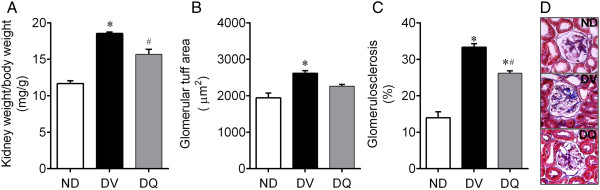
Kidney weight/body weight ratio (A), glomerular tuff area (B), glomerulosclerosis (C) in diabetic mice treated with quercetin (DQ) compared to diabetic mice administered with vehicle (DV) and non-diabetic (ND) mice. The mean value of 30 individual glomeruli areas from each kidney were used to calculate the glomerular tuff area and glomerulosclerosis. Micrographs (D) are representative glomerular sections (magnification of 400x) stained with Masson trichrome to identify sclerosis (blue) in each glomerulus. Values are means ± SEM for n = 6–8 mice per group. *p < 0.05 vs. ND, # p < 0.05 vs. DV.