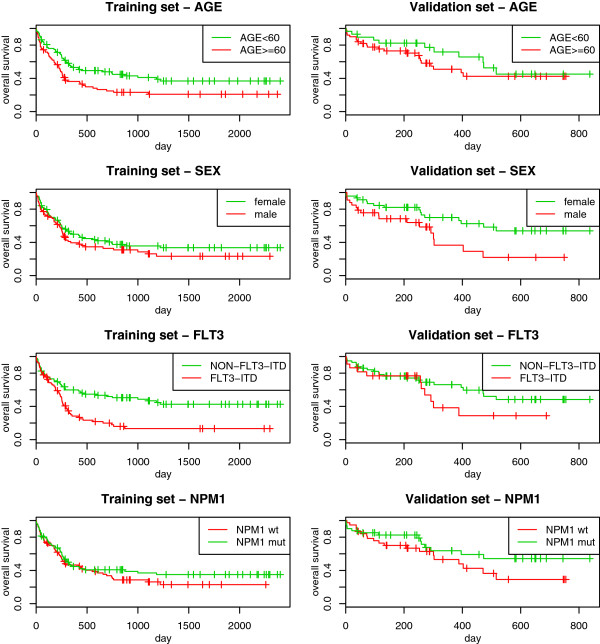
Figure 1.

AML: univariate Kaplan-Meier curves. Acute myeloid leukemia: Kaplan-Meier estimation of the survival curves in subgroups based on age (first row), sex (second row), FLT3-ITD (third row) and NPM1 (fourth row), computed in the training (first column) and in the validation (second column) sets.
