
Figure 6.
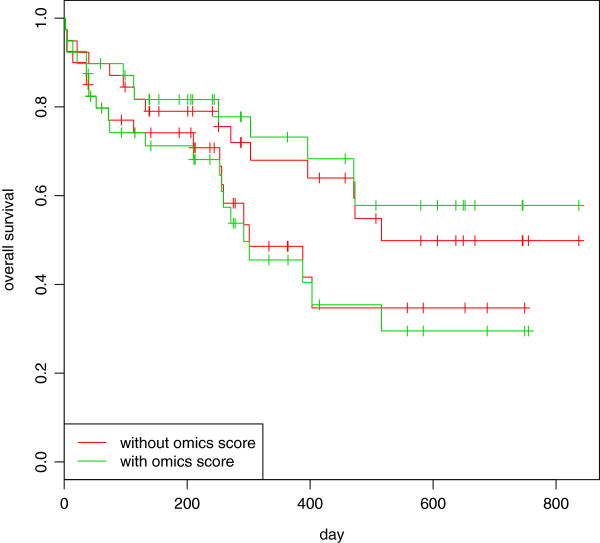
AML: Kaplan-Meier curves for low and high-risk groups. Acute myeloid leukemia: Kaplan-Meier curves computed in the validation set for risks groups based on the clinical (red) and the combined (green) scores derived in the training set: the curves below represent the survival curves for observations belonging to the high risk group, the two above the low risk group.