
Figure 1.
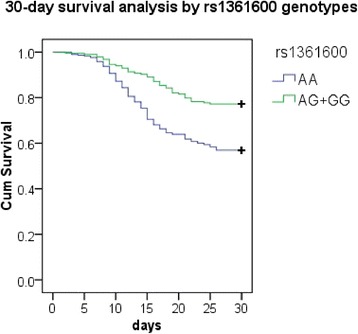
Kaplan–Meier survival analysis of patients with severe sepsis according to the genotypes of rs1361600. Differences between groups were compared by log-rank analysis. Kaplan–Meier 30-day survival curves showed strong significant differences between the subjects who carried the AA genotype and the subjects who carried the AG + GG genotypes (P = 5.92 × 10⁻⁵).