
Figure 1.
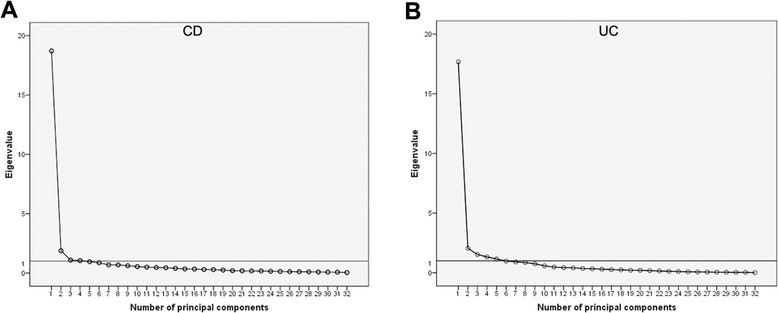
Scree plots of MCIBDQ from the exploratory factor analysis. The horizontal line represents the cut-off for selecting the number of factors. A, CD patients group; B, UC patients group.
Official websites use .gov
A
.gov website belongs to an official
government organization in the United States.
Secure .gov websites use HTTPS
A lock (
) or https:// means you've safely
connected to the .gov website. Share sensitive
information only on official, secure websites.
Scree plots of MCIBDQ from the exploratory factor analysis. The horizontal line represents the cut-off for selecting the number of factors. A, CD patients group; B, UC patients group.