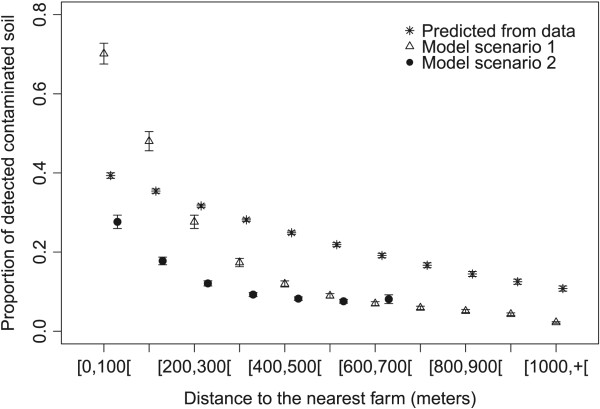
Figure 2.

Average proportion of detectable contaminated soil for each class of distance to the nearest farm predicted by a logistic regression performed on field data probability of contaminated sample = f(distance to the nearest farm) (stars), by ABM model setting 1 with farm within the village (triangles), by ABM model setting 2 with scattered farms (filled dots). 95% confidence intervals of the average of the 200 simulations (for each setting) were added for the ABM model predictions. Note that there was no soil sampling further than 900 meters of any farm, and that in setting 2 there was no patch beyond 700 meters of any farm. The x-coordinates vary between the 3 data series for more readability of the confidence intervals.
