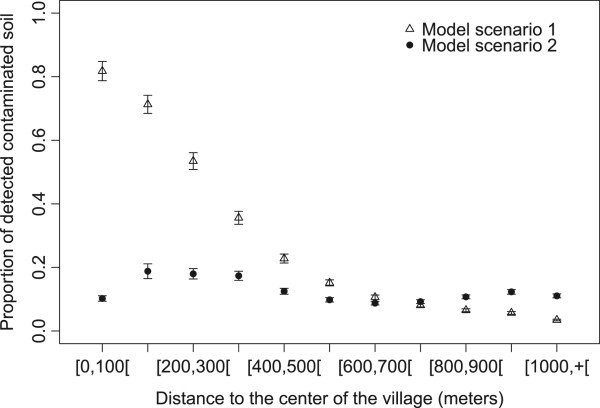
Figure 5.

Average proportion of detectable contaminated soil for each class of distance to the center of the village predicted by ABM model setting 1 with farm within the village (triangles), by ABM model setting 2 with scattered farms (filled dots). 95% confidence intervals of the average of the 200 simulations (for each setting) were represented. The x-coordinates vary between the 3 data series for more readability of the confidence intervals.
