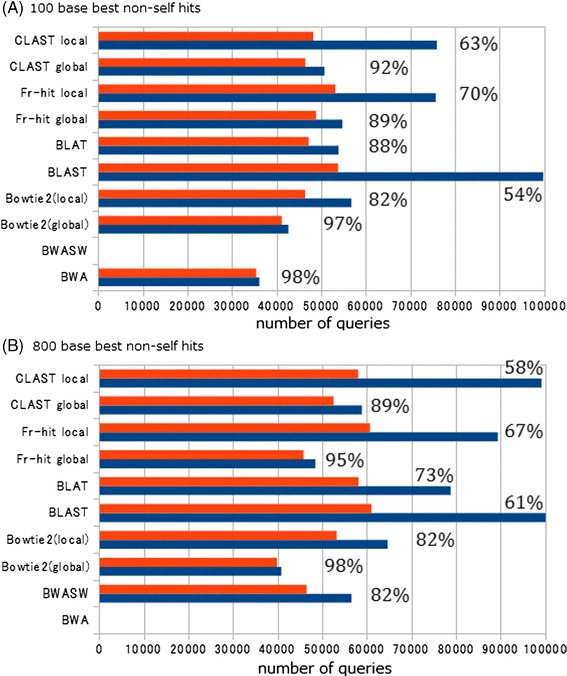
Figure 8.

Results of the simulated metagenomic analysis test. Blue: Number of query reads that had at least one similar sequence in the database (total reported hits). Red: Number of query reads with correct taxonomic assignment (correct genus assignments). Percentages are the CGA ratio (correct genus assignments/total reported hits × 100). Horizontal axis represents number of queries. (A) Results of 100 base test. (B) Results of 800 base test.
