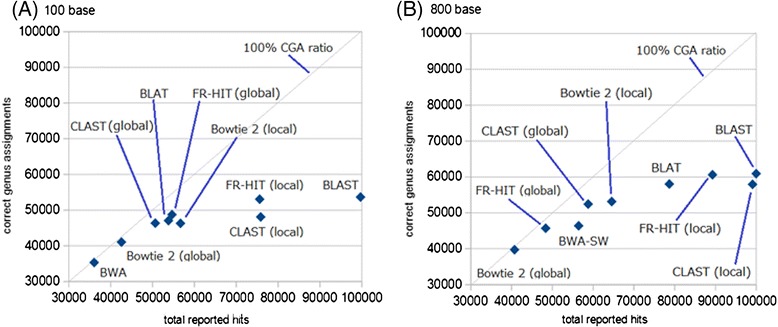
Figure 9.

Relationships of sensitivity (total reported hits) and specificity (correct genus assignments) for each software both of the 100 base test and the 800 base test. Each point represents the result of simulated metagenomic analysis of BLAST, BLAT, CLAST (both global and local mode), FR-HIT (both global and local mode), BWA, BWA-SW, Bowtie 2 (both global and local mode). The gray slanting line of each graph represents 100 % CGA ratio. All points cannot be above the gray line. Horizontal axis represents total reported hits, and vertical axis represents correct genus assignments. (A) Results of 100 base test. (B) Results of 800 base test.
