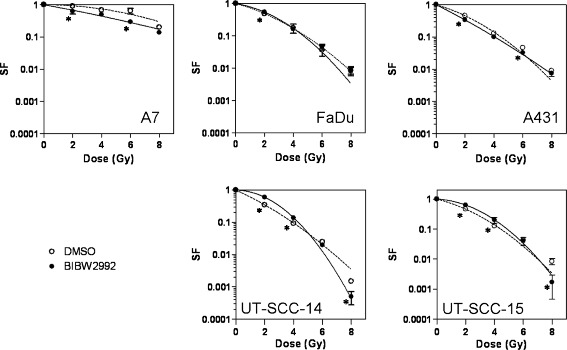
Figure 4.

Clonogenic cell survival of A7, A431, FaDu, UT-SCC-14 and UT-SCC-15 cells irradiated with different total doses after three days incubation with normal medium (DMSO; o) or BIBW 2992 (•), plating directly after irradiation. Symbols and error bars represent means and standard deviations of three independent experiments (duplicates). The data were fitted according to the LQ model (dotted line = normal medium, solid line = BIBW 2992).* significant difference (for dose groups in comparison to control group).
