
Figure 1.
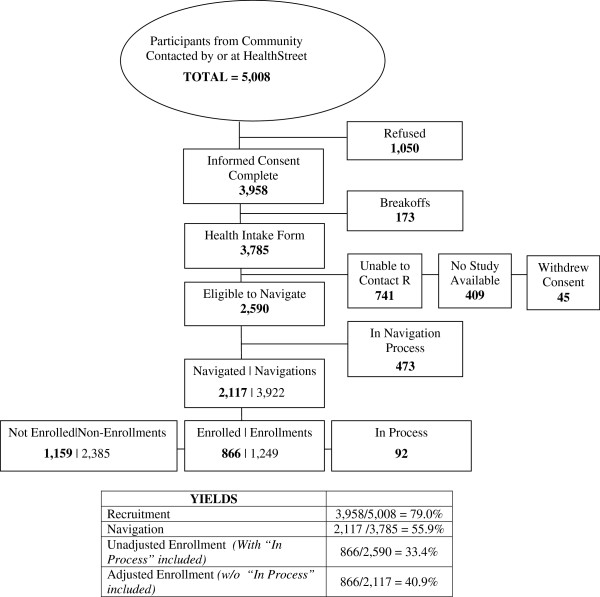
Participant Flowchart, HealthStreet Gainesville, October 2011 through May 2014. Numbers in bold represent PEOPLE, not events.
Official websites use .gov
A
.gov website belongs to an official
government organization in the United States.
Secure .gov websites use HTTPS
A lock (
) or https:// means you've safely
connected to the .gov website. Share sensitive
information only on official, secure websites.
Participant Flowchart, HealthStreet Gainesville, October 2011 through May 2014. Numbers in bold represent PEOPLE, not events.