
Figure 3.
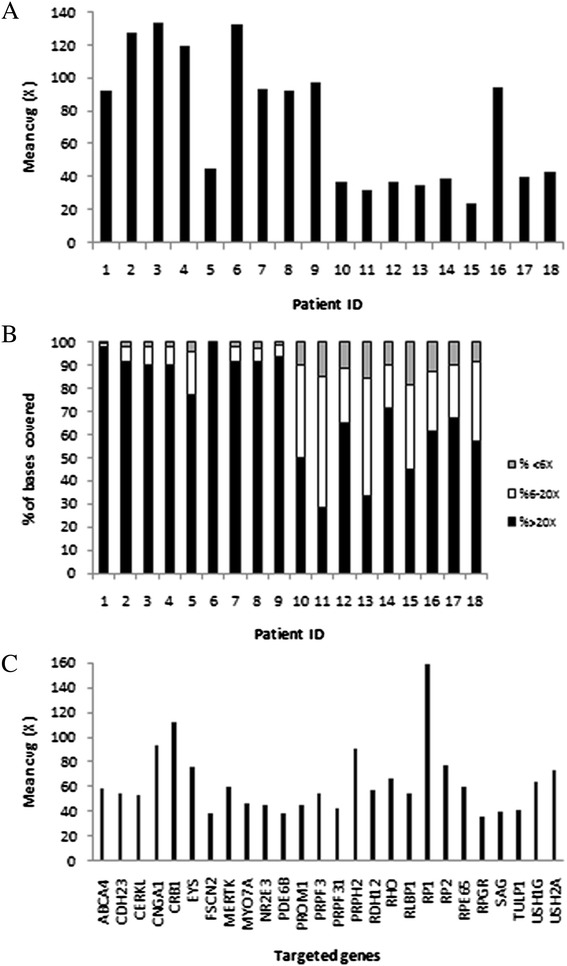
Coverage analysis of 454 pyrosequencing data of the 18 samples used for IRD panel validation. (A) Mean coverage of the targeted regions for each individual. (B) Percentage of targeted positions covered less than 6x (gray), between 6x and 20x (white), and more than 20x (black), for each individual. (C) Mean coverage for each targeted gene.