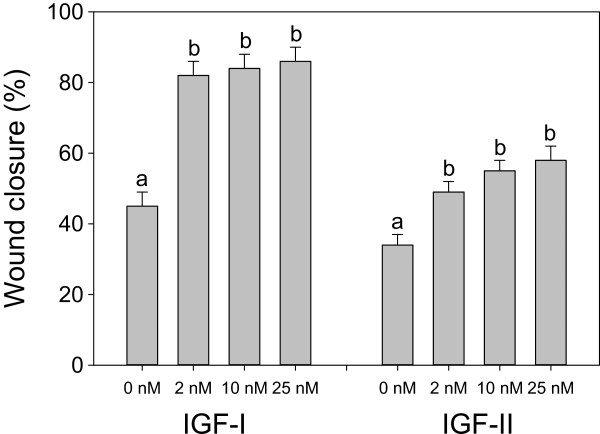
Figure 1.

Effects of IGF-I and IGF-II dose on migration of HTR-8/SVneo cells. IGF-I and –II experiments were conducted separately and therefore have different control values. Values are mean ± standard error of the mean, and values with different superscript letters within an experiment are significantly different according to Tukey’s HSD test (overall variation in IGF-I experiments: F3, 20 = 28.65, P < 0.0001, N = 6 per treatment; IGF-II experiments: F3, 43 = 12.86, P < 0.0001, N = 6–14 per treatment).
