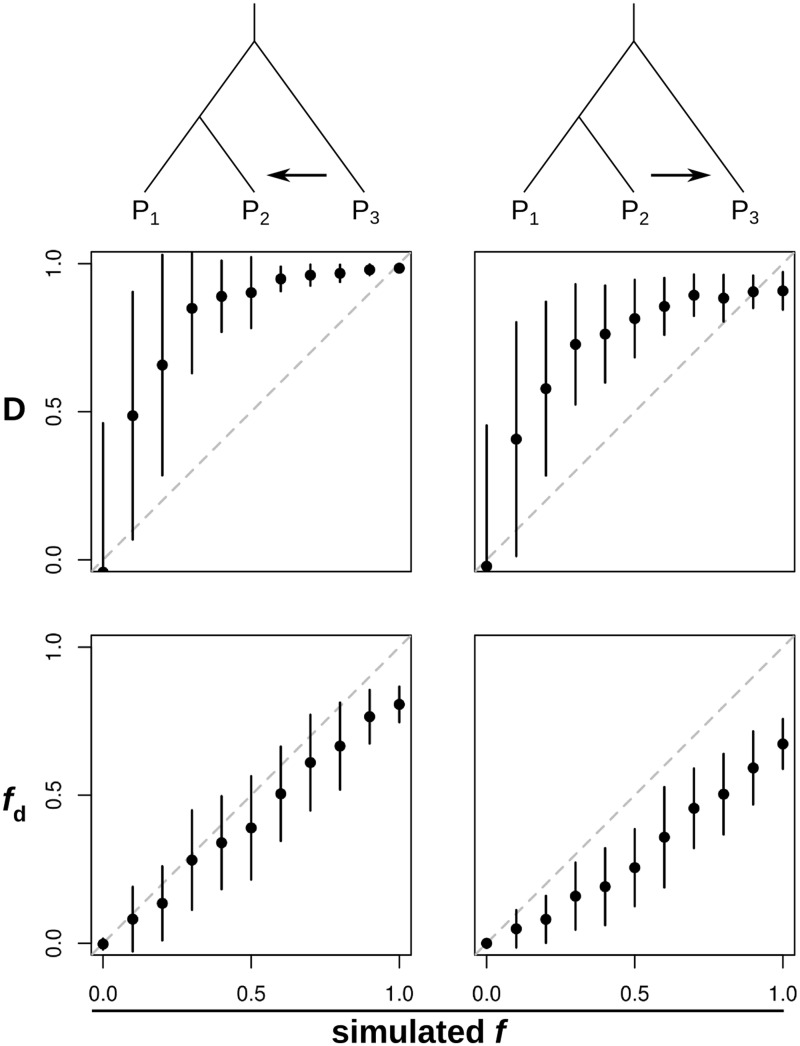
Fig. 2.
Comparing statistics to detect and quantify introgression. Results from a subset of the simulations: window size 5 kb, time of gene flow (tGF) 0.1 × 4N generations ago, and population recombination rate 0.01. See supplementary figure S1A–I, Supplementary Material online, for full results. Plots show means and standard deviations for D and , calculated over 100 simulated sequences (see Materials and Methods for details). Simulations covered 11 different values of f, the proportion of introgression. Gene flow was simulated either from P3 to P2 (left-hand column) or from P2 to P3 (right-hand column). Dashed diagonal lines show the expectation of a perfect estimator of f.

