Fig. 2.
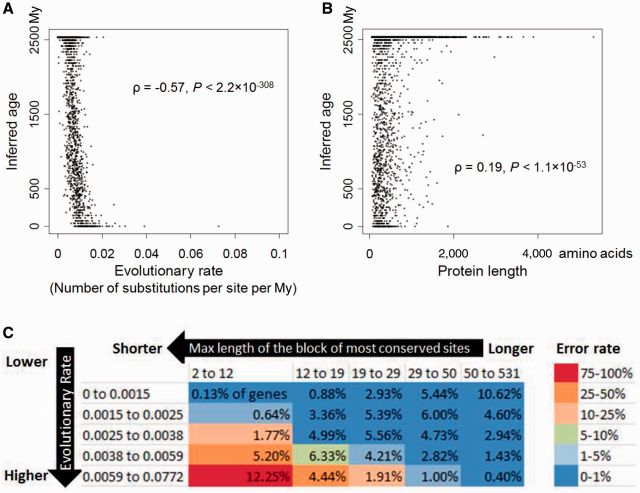
Gene age inference by BLAST is influenced by (A) protein evolutionary rate, (B) protein length, and (C) the maximum length of the block of the most conserved sites in the protein. Presented are the average results from ten simulations. In (A) and (B), each dot represents one fruit fly protein, whose age equals the average inferred age over ten simulations. In (C), each row and each column represents an equal number of genes. The number in each bin corresponds to the fraction of genes from ten simulations that fall into the bin. The color of each bin represents the average error rate in that bin, with the color scheme shown on the right of the figure. Error was considered when a gene was inferred to have originated after the separation between bacteria and eukaryotes. Max length is in the unit of amino acid, whereas evolutionary rate is in the unit of number of substitutions per site per My. As shown in the main text by partial correlations, each of the three factors has a significant contribution to BLAST error even when the other two are controlled.

