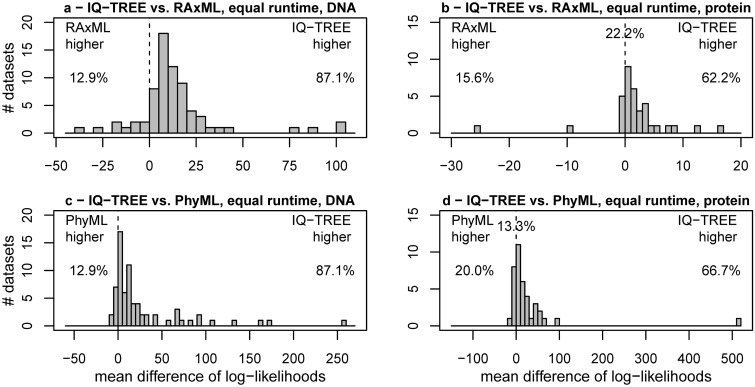
Fig. 1.
Performance of IQ-TREE for fixed CPU times: (a, b) Display frequencies of log-likelihood differences for IQ-TREE minus RAxML for 70 DNA (a) and 45 AA (b) alignments. (c) and (d) show the same if IQ-TREE is compared with PhyML. IQ-TREE’s CPU times were limited to those required by RAxML and PhyML, respectively. The percentages on the dashed line in (b) and (d) represent the fraction of alignments where log-likelihood differences are smaller than 0.01.

