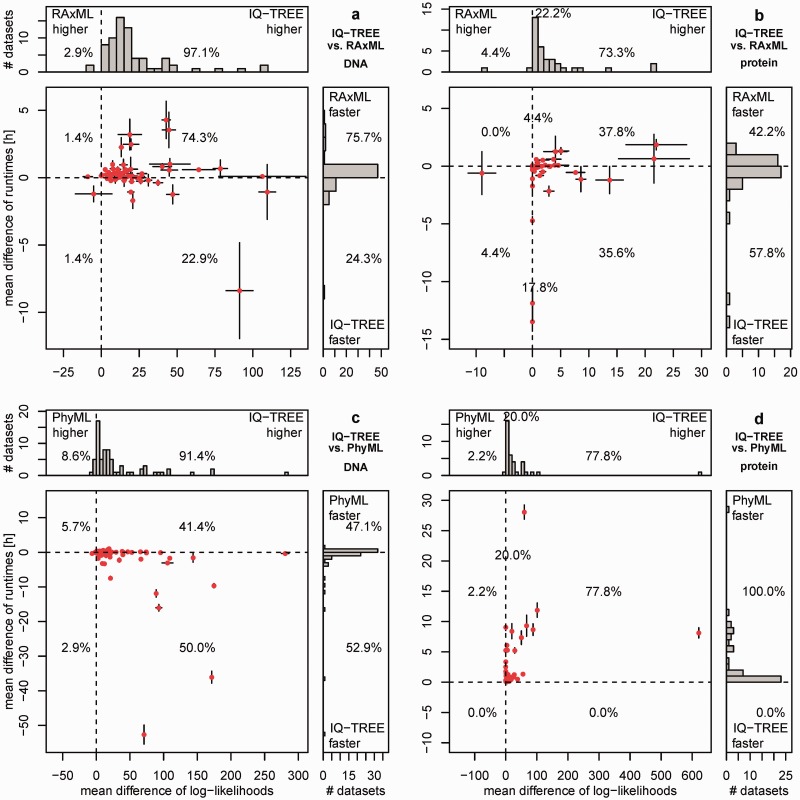
Fig. 2.
Performance of IQ-TREE for variable CPU times: The upper plots (a, b) show the performance of IQ-TREE against RAxML using the 70 DNA (a) and 45 AA (b) alignments. The lower plots (c, d) show the same against PhyML. Each dot in the main diagrams represents for one alignment the mean differences of the CPU times (y axis) and of the mean differences of log-likelihoods (x axis) of the reconstructed trees by the programs compared. The whiskers at each point show the standard errors of the differences. The histograms at the top and the side present the marginal frequencies. Dots to the right of the vertical dashed line represent alignments where IQ-TREE found a higher likelihood. If a dot is below the horizontal dashed line, the reconstruction by IQ-TREE was faster. Percentages in the quadrants of histograms denote the fraction of alignments in that region. Percentages on the dashed line reflect the number of alignments where log-likelihood differences are smaller than 0.01 (see [b] and [d]).

