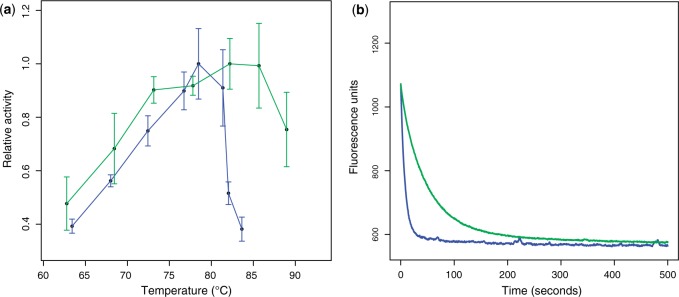
Fig. 4.

Resurrection of ancestral LeuBs and impact of the phylogenetic tree on biological interpretations. (a) Thermoactivity profiles for ancestral LeuB enzymes. Blue curve: LeuBS–unaw. Green curve: LeuBS–aw. (b) Unfolding rates of ancestral LeuB enzymes. Unfolding rates are shown in 8 M urea as a decrease in intrinsic protein fluorescence with time. Colors are the same as in (a).
