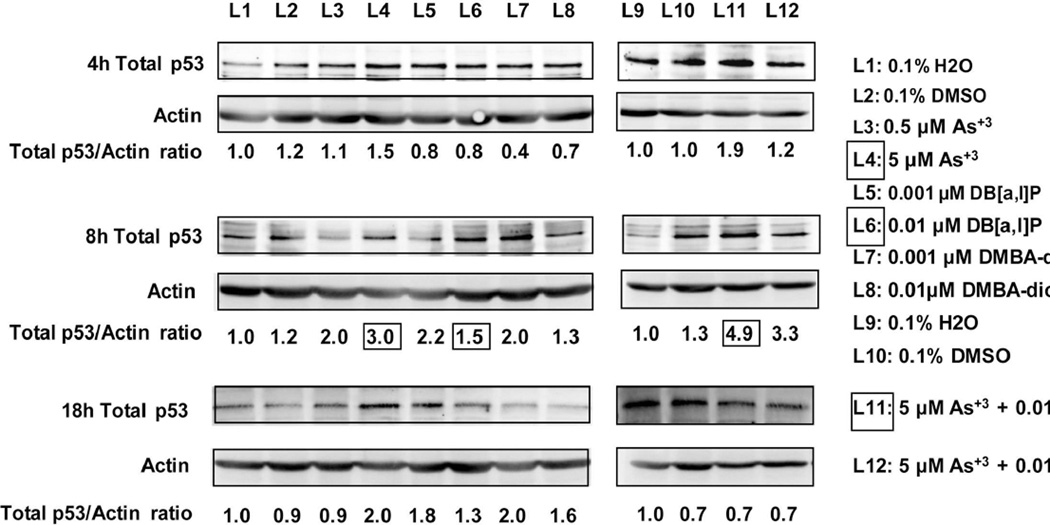
Fig. 8.
Western Blot analysis of As+3 and PAHs effects on whole cell lysate p53 protein levels in murine spleen cells treated in vitro at the indicated concentrations for 4, 8, or 18 hrs. Numbers shown at the bottom of each gel lane are the fold inductions for p53 protein normalized to actin and compared to controls (H2O for As+3 and DMSO for PAHs) and treated cells. The boxed numbers show the comparison for 5 µM As+3 induction (L4) of p53 at 8 hrs, as compared to 0.01 µM DB[a,l]P (L6) and the combination of both agents (L11).

