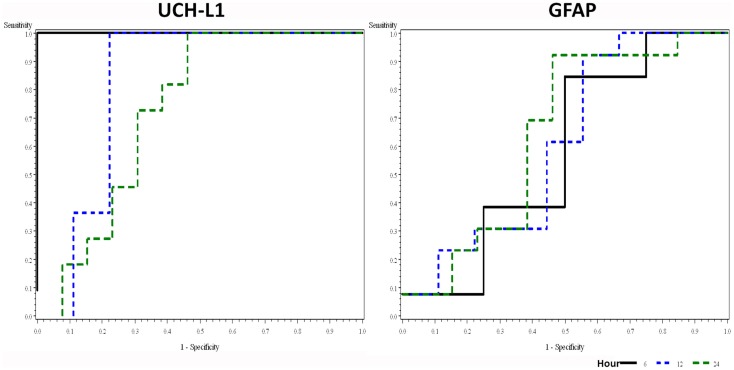
Figure 2.
Receiver–operator characteristic plots of UCH-L1 and GFAP at different time point in detecting HIE. Area under curve (AUC with 95% confidence interval) for UCH-L1 is 1.00, 0.83 (0.57–1.00), and 0.73 (0.51–0.94) for 0–6, 12, and 24 h, respectively. AUC (95% CI) for GFAP is 0.58 (0.15–1.00), 0.61 (0.33–0.88), and 0.64 (0.41–0.87) for 0–6, 12, and 24 h, respectively.

