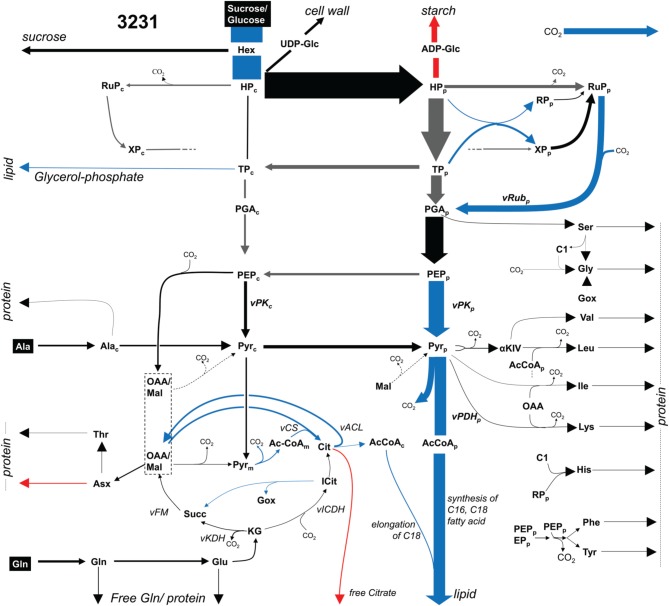
Figure 3.
Flux map for accession 3231 (13C-MFA). Flux distribution map showing glycolysis, pentosephosphate pathway, the TCA cycle and biosynthetic effluxes into protein, lipid and free soluble metabolites for accession 3231. Arrow thickness indicates carbon flux. Significant higher (lower) values in accession 3170 are marked in blue (red). Gray arrows: high statistical uncertainty (SD > 50% of flux value). Abbreviations: Metabolites (subscripts “p,” chloroplast; “c,” cytosol): AcCoA, acetyl-Coenzyme A; aKIV, 2-keto-isovalerate; C1, 5,10-methylene- or 5-formyl -tetrahydrofolate; Cit, citrate; GOX, glyoxylate; Hex, hexose, representing free hexoses and sucrose; HP, hexose phosphate; Icit, isocitrate; KG, ketoglutarate; OAA, lumped pool of subcellular pools of oxaloacetate and malate; PEP, phosphoenol pyruvate; PGA, 3-phospho glycerate; Pyr, pyruvate; RP, ribose 5-phosphate; RuP, Ribulose 5-phosphate; Succ, succinate; TP, triose phosphate (dihydroxyacetone phosphate, glyceraldehyde 3-phosphate); XP, xylulose 5-phosphate. Reactions: vACL, ATP:citrate lyase; vCS, citrate synthase; vFM, fumarase, malate dehydrogenase; vICDH, isocitrate dehydrogenase; vPDH_p, plastidic pyruvate dehydrogenase; vPK_p, plastidic pyruvate kinase; vRub_p, ribulose bisphosphate carboxylase.

