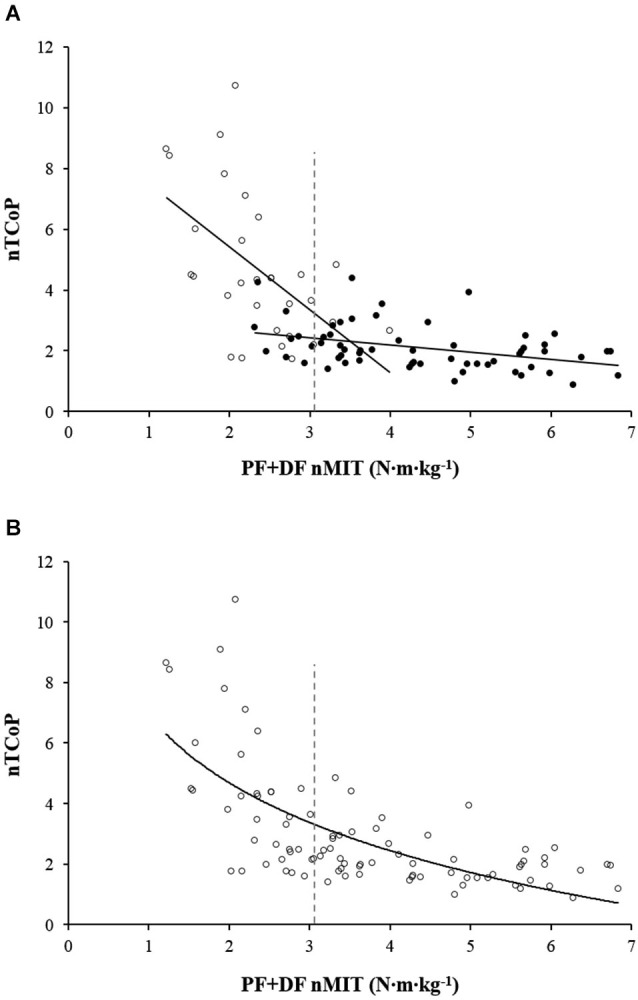
Figure 1.

Relationship between TCoP displacement normalized for height (nTCoP) and the sum of plantar (PF) and dorsal (DF) flexors maximal isometric torque normalized for body weight (FP + FD nMIT). (A) represents the linear relationship between nTCoP and PF + DF nMIT for non-fallers (filled circle) and elderly fallers (EF) (empty circle). The linear regressions equations are nTCoP = −0.24·(FP + FD nMIT)+3.14 (r = 0.40, P < 0.001) for non-fallers and nTCoP = −2.07·(FP + FD nMIT) + 9.56 (r = 0.55, P < 0.001) for EF. The vertical gray dashed line represents the cut-off value of PF + DF nMIT that distinguishes between EF and non-fallers. It corresponds to the highest Youden index obtained from receiver operating characteristic analysis. (B) represents the logarithmic relationship between nTCoP and PF + DF nMIT for the whole sample; the equation is: nTCoP = −7.44·log10(FP + FD nMIT) + 6.93, (r = 0.68, P < 0.001). The vertical gray dashed line represents the cut-off value of PF + DF nMIT that distinguishes between EF and non-fallers. It corresponds to the highest Youden index obtained from receiver operating characteristic analysis.
