
Figure 2.
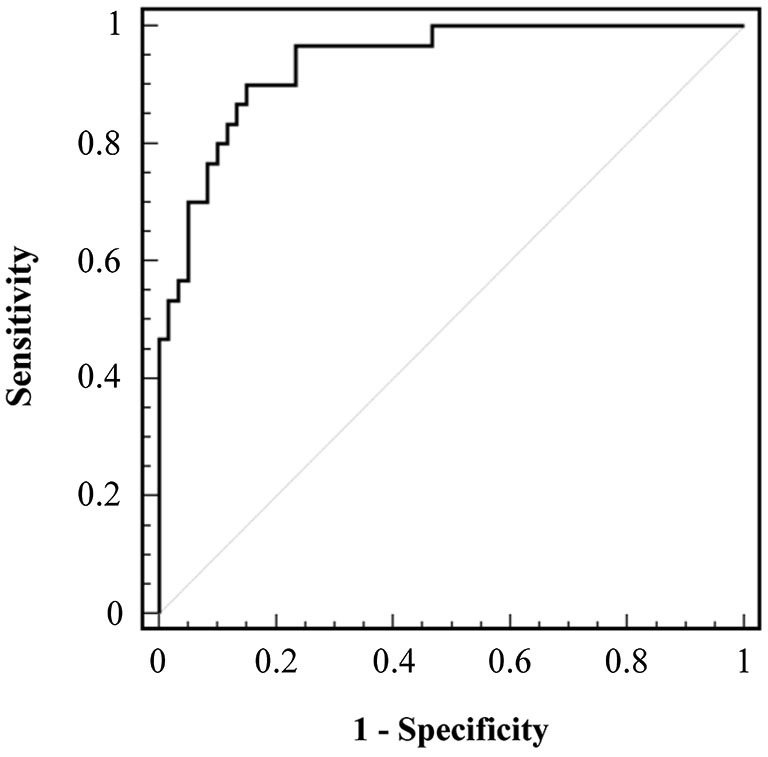
Receiver Operating Characteristic (ROC) curve of the sum of maximal isometric torque of plantar flexion and dorsal flexion normalized for body weight (PF + DF nMIT). ROC curve of the sensitivity against the false-positive rate (1—specificity) plotted across a range of thresholds is represented. The major diagonal represents an area of curves equal to 0.5 and a prediction no better than chance. The black line represents the results taken from the PF + DF nMIT measurements.