
Figure 1.
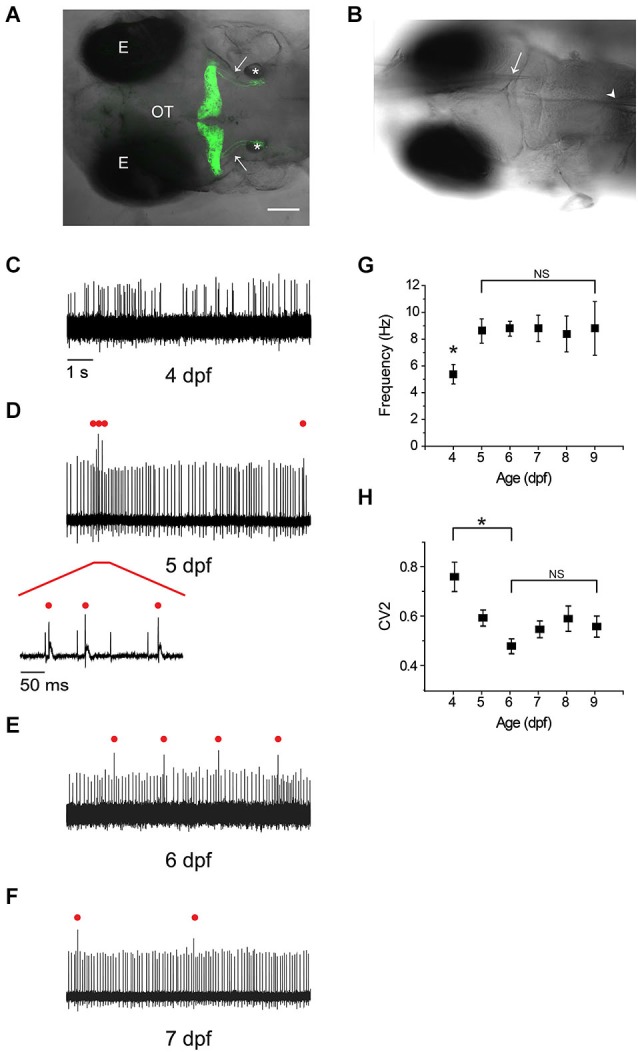
Rapid emergence and maturation of excitability in zebrafish Purkinje cells. (A) Dorsal view of la118Tg:Tg(aldoca:gap43-Venus) transgenic zebrafish at 5 dpf shows that membrane-bound Venus is specifically and exclusively expressed in cerebellar Purkinje cells (Tanabe et al., 2010). Anterior is to the left. A z-projection of 168 1 μm confocal images has been superimposed on the corresponding bright field image. Images were acquired with an Olympus Fluoview FV300 laser scanning confocal microscope. Labels: E, eye; OT, optic tectum; *, otic vesicle; arrows, cerebellovestibular axon tracts. Scale bar, 100 μm. (B) The recording configuration is shown. A transgenic zebrafish at 5 dpf has been fixed in the recording chamber. A loose-patch electrode (arrow) was inserted from the anterior side and advanced to contact the cell body of a Purkinje cell. In some experiments, a theta pipette (arrowhead) was placed in the inferior olive to stimulate climbing fibers. (C–F) Shown are representative loose-patch recordings acquired at (C) 4 dpf, (D) 5 dpf, (E) 6 dpf, and (F) 7 dpf. In (D), red bar marks portion of trace that is shown on an expanded time scale below the main trace. In (D), (E), and (F), complex spike-like events are indicated by red dots. (G) The average simple spike firing frequency has been plotted vs. age (n = 7–31 cells from 6–24 animals). The frequency at 4 dpf, 5.4 Hz, was significantly different from the frequency on all subsequent days, which averaged ~9 Hz (*, ANOVA: 4–9 dpf, F(5,113) = 2.41, p = 0.04, followed by Tukey’s post hoc test: 4 and 5 dpf, p < 0.05). Values obtained between 5 and 9 dpf did not differ significantly (NS, ANOVA: 4–9 dpf, F(5,113) = 2.41, p = 0.04, followed by Holm-Bonferroni post hoc test: 5–9 dpf, p ≥ 0.05). (H) The regularity of spontaneous tonic firing was quantified by determining the coefficient of variation of adjacent intervals (CV2), which has been plotted against age(n = 7–31 cells from 6–24 animals). CV2 declined significantly from 4 dpf (CV2 = 0.76) to 6 dpf (CV2 = 0.48); CV2 did not differ significantly from 6–9 dpf (ANOVA: 4–9 dpf, F(5,113) = 5.83, p = 7.96 × 10⁻⁵, followed by Holm-Bonferroni post hoc test: 4–6 dpf, p < 0.05 [*] and 6–9 dpf, p ≥ 0.05 [NS]).