
Figure 3.
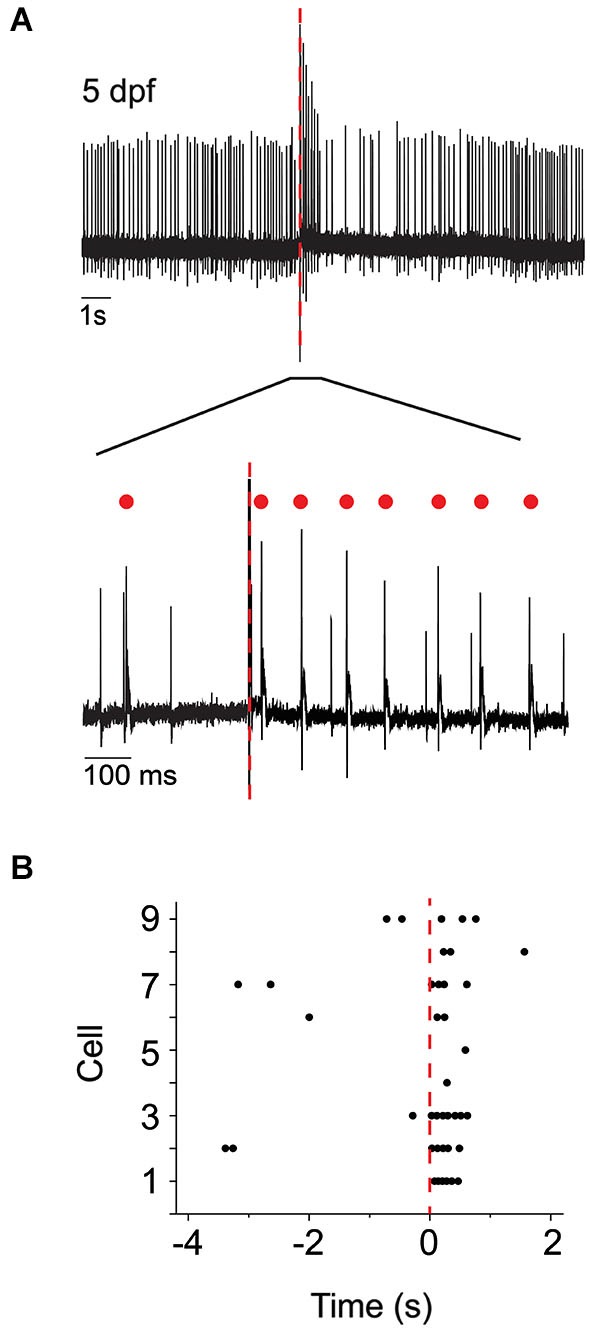
Direct electrical stimulation of inferior olive increases occurrence of complex spike-like events. (A) Upper: The inferior olive was stimulated using a theta pipette (see Figure 1B) at the time indicated by the red dashed line. Shown is a representative recording of Purkinje cell activity obtained at 5 dpf. Lower: The portion of the upper trace marked by a bar is shown on an expanded time scale. Red dots indicate complex spikes. (B) Peristimulus raster plot shows the occurrence of complex spikes before and after stimulation of the inferior olive at time 0 (red dashed line). Results were obtained from nine Purkinje cells from four animals at 5 dpf. The trace shown in panel (A) corresponds to cell #3.