
Figure 4.
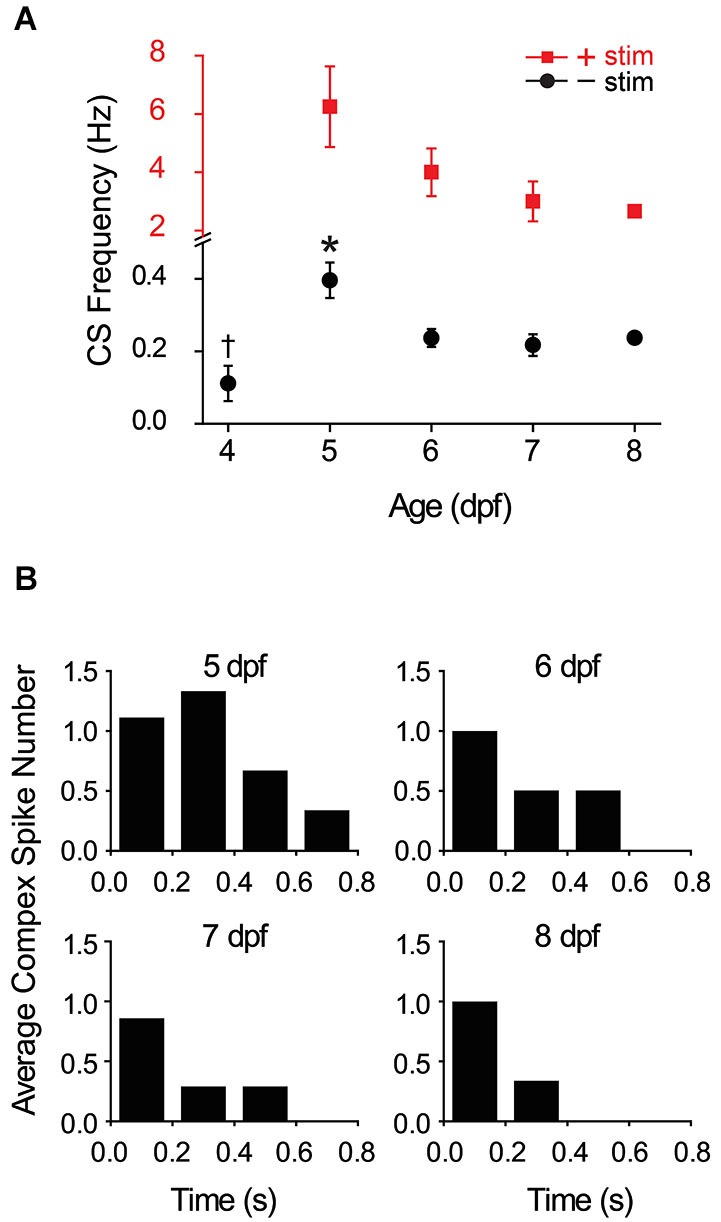
Development and winnowing of functional connections between climbing fibers and Purkinje cells. (A) The average frequency of complex spiking in Purkinje cells in the absence (black circles) and presence (red squares) of direct electrical stimulation of the inferior olive has been plotted vs. age. Note change in vertical scale for data obtained in the absence (black) and presence (red) of stimulation. In the absence of stimulation, complex spike frequency was averaged over 10 s recordings; the frequency at 5 dpf (0.4 Hz) was significantly higher than on all subsequent days (*, ANOVA: 4–8 dpf, F(4,67) = 6.17, p = 2.75 × 10⁻⁴, followed by Tukey’s post hoc test: p < 0.05; n = 6–20 cells, 5–17 animals). The frequency at 4 dpf (0.11 Hz) was significantly lower than that measured at 6 dpf (0.24 Hz) (†, ANOVA: 4–8 dpf, F(4,67) = 6.17, p = 2.75 × 10⁻⁴, followed by Tukey’s post hoc text: p < 0.05; n = 7 and 20 cells, 6 and 14 animals at 4 and 6 dpf, respectively). Complex spike frequency did not vary significantly between 6 and 8 dpf (ANOVA: 4–8 dpf, F(4,67) = 6.17, p = 2.75 × 10⁻⁴, followed by Holm-Bonferroni post hoc test: 6–8 dpf, p ≥ 0.05; n = 6–20 cells, 5–14 animals). In the presence of stimulation, the frequency of complex spiking was averaged over the first 500 ms after the stimulus. Evoked complex spike frequency decreased from 6.3 Hz at 5 dpf (n = 9 cells, 4 animals) to 2.7 Hz at 8 dpf (n = 3 cells, 3 animals) (Spearman’s rank correlation, r = −1). Electrical stimulation increased complex spike frequency by ~16-fold at 5–6 dpf and by ~12-fold at 7–8 dpf. (B) Complex spiking was evoked by direct electrical stimulation of the inferior olive at 5–8 dpf. The average number of complex spikes per 200 ms bin after the stimulus has been plotted (n = 3–9 cells, 3–4 animals). Cells that did not fire complex spikes in the absence of stimulation were excluded from the analysis.