Figure 5.
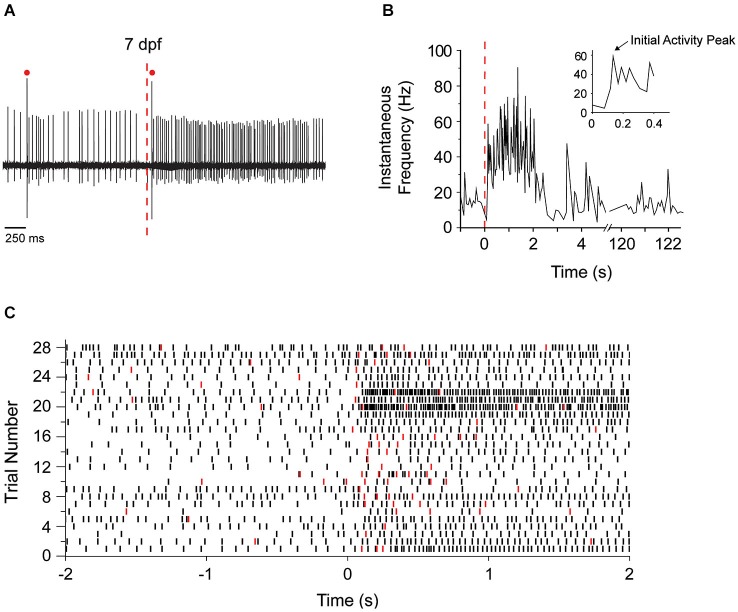
Sudden darkness increases the frequency of tonic firing and complex spiking. (A) Purkinje cell firing at 7 dpf was recorded before and after turning off the LED at the time indicated by the red dashed line. A representative trace is shown. Red dots indicate complex spikes. (B) The instantaneous tonic firing frequency in the cell shown in panel (A) was measured before and after the LED was turned off at time 0 (dashed red line). The frequency, which fluctuated around 15 Hz in the light, increased significantly to ~60 Hz during the first 150 ms after turning the LED off and remained elevated at ~40–60 Hz for several seconds. Inset shows the instantaneous firing frequency during the first 500 ms of darkness on an expanded time scale. The arrow indicates the initial peak in firing frequency after the stimulus, which corresponds to the direct response of the Purkinje cell to sudden darkness (see Figure 7). (C) Peristimulus raster plot shows the timing of simple action potentials (black symbols) and complex spikes (red symbols) before and after the LED was turned off at time 0. Data were obtained from 28 trials in 11 Purkinje cells from nine animals at 7 dpf. The trace shown in panel (A) corresponds to trial #23. At 7 dpf, the spontaneous tonic firing frequency in the absence of stimulation ranged from 4.5–19.5 Hz (mean ± SEM: 8.8 ± 0.98 Hz, n = 22 cells from 20 animals). After sudden darkness, the peak tonic firing frequency ranged from 19.4–100.7 Hz (mean ± SEM: 40.4 ± 7.4 Hz, n = 11 cells, nine animals).

