Figure 6.
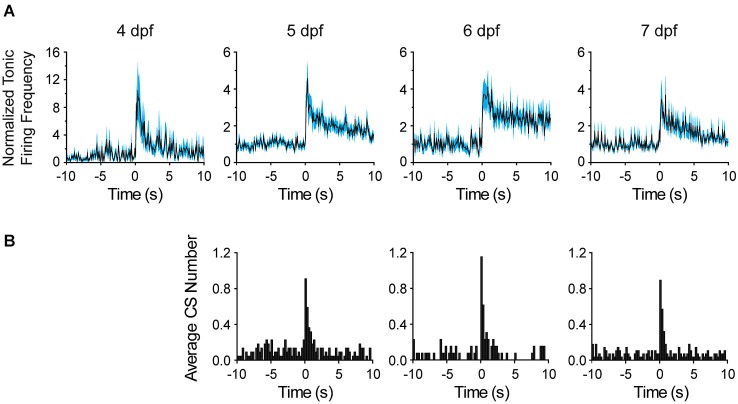
Comparison of Purkinje cell responses to sudden darkness at 4–7 dpf. (A) After turning the LED off at time 0, the frequency of tonic firing was calculated for each 100 ms interval and normalized to the average frequency calculated over the 10 s period prior to the stimulus (solid lines, n = 6–14 cells, 5–11 animals). The cyan-shaded areas represent the SEM. Please note compressed vertical scale at 4 dpf. (B) The bar graphs show the average number of complex spikes recorded in each 250 ms interval, calculated by dividing the total number of complex spikes in all cells by the number of cells (n = 13–28 trials from 8–11 cells, 5–9 animals). The LED was turned off at time 0. Note that sudden darkness did not evoke complex spikes at 4 dpf.

