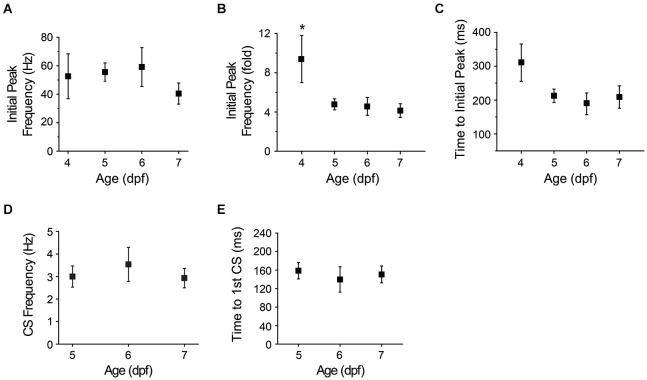
Figure 7.
Maturation of afferent pathways conveying visual information to cerebellum. (A) The graph shows the initial peak in instantaneous simple spike frequency after turning off the LED at different ages (see Figure 5B, inset). Values obtained at 4–7 dpf did not differ significantly (ANOVA: 4–7 dpf, F(3,35) = 0.75, p = 0.53, n = 6–14 cells, 5–11 animals). (B) Initial peak simple spike frequencies evoked by sudden darkness in panel (A) were normalized to the average simple spike frequency measured before turning off the LED and plotted vs. age. The fold-change in initial peak frequency was significantly higher at 4 dpf than on subsequent days (*, ANOVA: 4–7 dpf, F(3,35) = 4.36, p = 0.01, followed by Tukey’s post hoc test: p < 0.05, n = 6–14 cells, 5–11 animals). (C) The latency between turning off the LED and the initial peak in simple spike frequency has been plotted vs. age. The latency decreased from 311 ± 55 ms at 4 dpf to 212 ± 19 ms at 5 dpf, 189 ± 32 ms at 6 dpf and 209 ± 33 ms at 7 dpf (n = 6, 14, 9 and 11 cells at 4, 5, 6 and 7 dpf, respectively, 5–11 animals; Spearman’s rank correlation, r = −0.8). (D) The graph shows the complex spike frequency measured in the first 500 ms after turning off the LED at 5–7 dpf (n = 13–28 trials from 8–10 cells, 5–9 animals). Values did not differ significantly. (E) The graph shows the latency between turning off the LED and the first complex spike at 5–7 dpf. Values did not differ significantly (n = 9–24 trials from 8–10 cells, 5–9 animals). Trials in which sudden darkness did not evoke complex spikes within 500 ms post-stimulation were excluded from the analysis.

