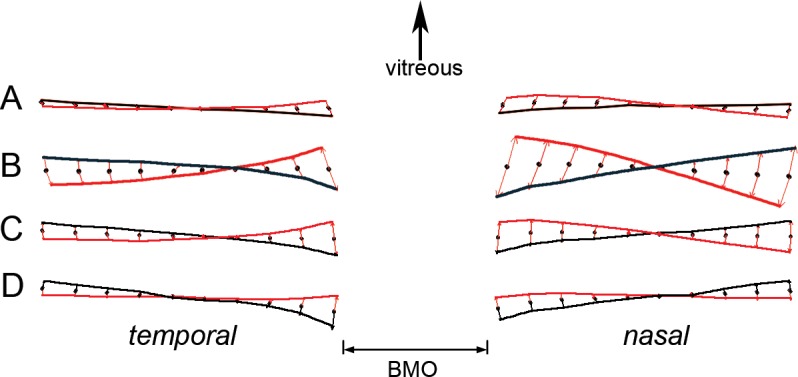
Figure 3.

Consensus (mean) shapes from each of the cohorts. (A) Lumbar puncture. (B) Cerebrospinal fluid shunt. (C) Medical treatment. (D) Post medical treatment versus normal subjects. Pre (baseline) shape, red line. Post treatment or post procedure, black line. The red arrows show the difference from the consensus of both pre and post groups (black dots). Top of the figure represents the relative direction of the vitreous.
