
Figure 3.
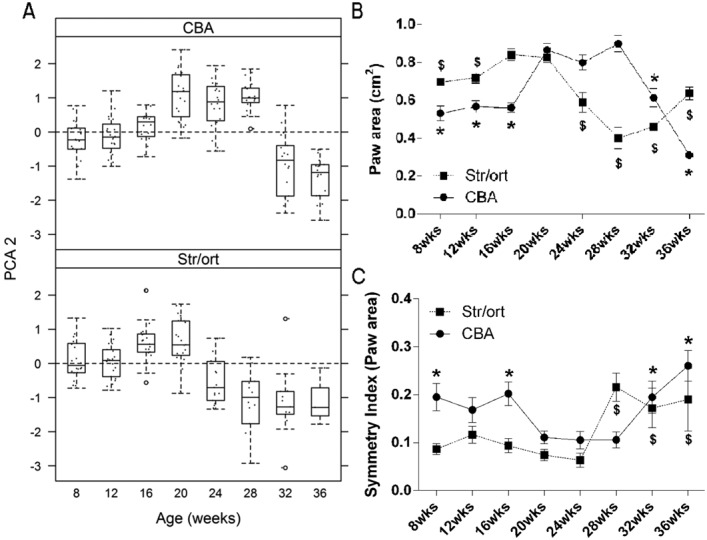
Longitudinal variation in the second principal component analysis (PCA2) and its individual component (paw area) reveals changes with aging in CBA and STR/Ort mice. A, Changes in PCA2 in CBA mice and STR/Ort mice between 8 and 36 weeks of age. Significant differences were noted between strains and over time. Data are shown as box plots. Each box represents the 25th to 75th percentiles. Lines inside the boxes represent the median. Dashed lines outside the boxes represent the 10th and the 90th percentiles. Dots represent individual mice. Circles indicate outliers. B, Paw area (mean of the left limbs and right limbs of each animal) in CBA and STR/Ort mice. In CBA mice paw area increased between 16 and 20 weeks of age and decreased from 28 weeks, whereas in STR/Ort mice paw area decreased from 20 weeks of age. ∗ = statistically significant difference from 20-week value in CBA mice (P = 0.000 at 8 weeks, 12 weeks, 16 weeks, 32 weeks, and 36 weeks); $ = statistically significant difference from 20-week value in STR/Ort mice (P = 0.001 at 8 weeks, P = 0.003 at 12 weeks, P = 0.000 at 24 weeks, 28 weeks, and 32 weeks, and P = 0.017 at 36 weeks). C, Symmetry index for paw area in CBA and STR/Ort mice. In STR/Ort mice, the symmetry index was similar between 8 and 24 weeks of age and showed significant increases in asymmetry from 28 weeks of age, whereas CBA mice exhibited diminished asymmetry between 20 and 28 weeks of age. ∗ = statistically significant difference from 20-week value in CBA mice (P = 0.014 at 8 weeks, P = 0.008 at 16 weeks, P = 0.016 at 32 weeks, and P = 0.000 at 36 weeks); $ = statistically significant difference from 20-week value in STR/Ort mice (P = 0.000 at 28 weeks, P = 0.001 at 32 weeks, and P = 0.019 at 36 weeks). Values in B and C are the mean ± SEM. For CBA mice, n = 20 at all time points; for STR/Ort mice, n = 22 at weeks 8, 12, and 16, n = 21 at week 20, n = 17 at week 24, n = 14 at week 28, n = 13 at week 32, and n = 3 at week 36.