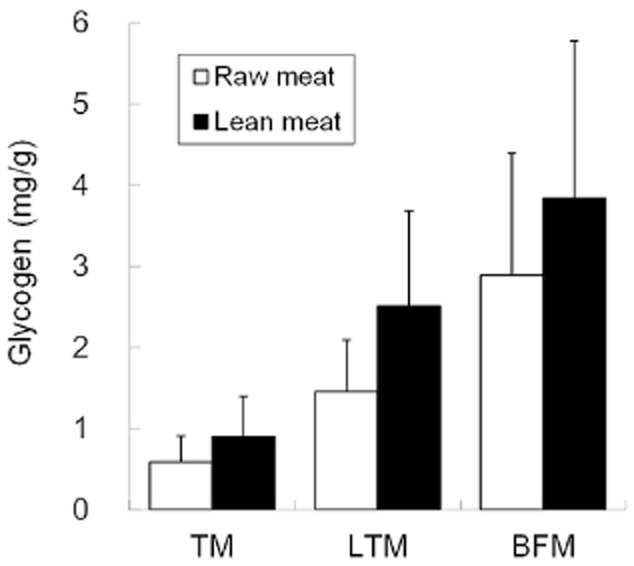
Figure 1.

Comparison of glycogen concentration in three different muscles. The mean glycogen concentration in each muscle was calculated and represented as mg/g raw meat (open bar) or lean meat (filled bar). The error bars indicate the standard deviation (n = 19). TM, Trapezius muscle; LTM, Longissimus thoracis muscle; BFM, Biceps femoris muscle.
