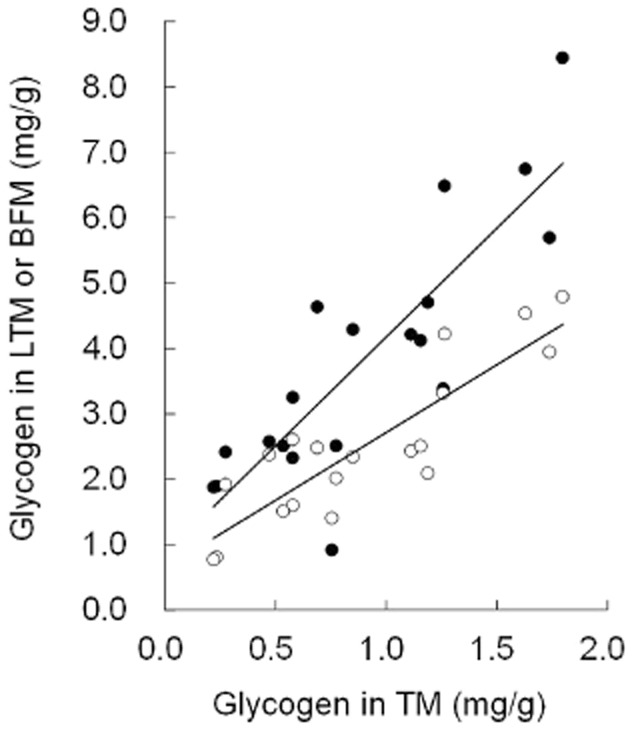
Figure 2.

Correlation of glycogen concentration of the Trapezius muscle (TM) with that of the Longissimus thoracis muscle (LTM) or Biceps femoris muscle (BFM) (mg/g lean meat). Each symbol represents the correlation between TM and LTM (○, y = 2.069x + 0.647 (P < 0.01, r = 0.87), n = 19) or between the TM and BFM (•, y = 3.323x + 0.852 (P < 0.01, r = 0.85), n = 19).
