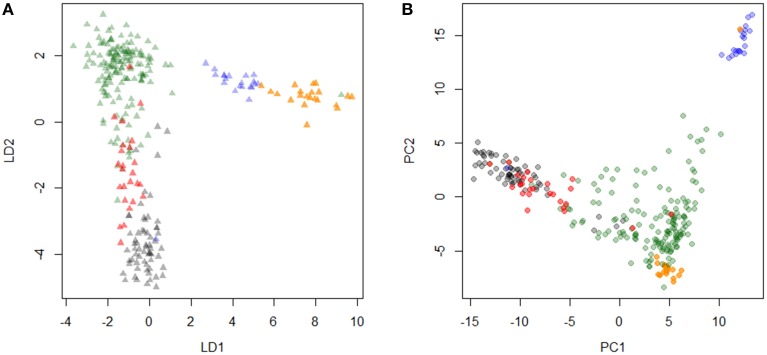
Figure 1.
Principal component analysis of Kenyan and other dairy cattle breeds. Discriminant analysis of principal component (DAPC) and principal component analysis (PCA) are plotted (A,B, respectively). Each color represents black, Holstein; red, Kenyan Friesian; green, Kenyan crossbreds; blue, Guernsey; orange, Norwegian Red.

