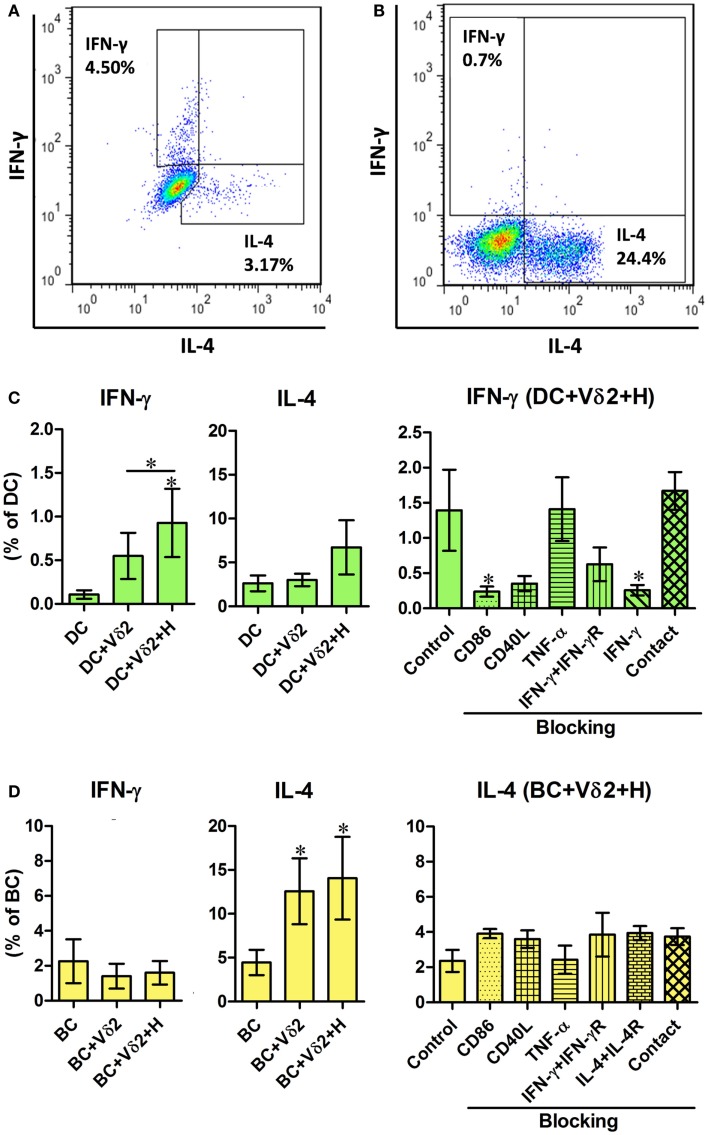
Figure 2.
Vδ2 T cells induce distinct cytokine profiles by DC and B cells. DC or B cells were co-cultured with HMB-PP-expanded human Vδ2 T cells in the absence or presence of HMB-PP (denoted H) for 24 h. The cultures were then treated with monensin for a further 16 h and stained for cell surface expression of CD11c or CD19 and CD3 and Vδ2 and intracellular expression of IFN-γ or IL-4 and analyzed by flow cytometry. (A,B) Representative flow cytometric dot plots showing IFN-γ and IL-4 expression by gated CD11c+ cells (DC) and CD19+ cells (BC), respectively. (C,D) Left and center panels show mean (±SEM) percentages of (C) DC (n = 10) and (D) BC (n = 10) that express IFN-γ and IL-4, respectively. Right panels show mean (±SEM) percentages of (C) DC and (D) BC expressing IFN-γ and IL-4, respectively, after co-culturing them with Vδ2 T cells in the presence of HMB-PP in the absence (control) or presence of blocking mAbs specific for CD86, CD40L, TNF-α, IFN-γ + IFN-γR, IL-4 + IL-4R or with the DC (n = 5), or BC (n = 3) separated from Vδ2 T cells using transwell inserts. *p < 0.05 using a paired t-test, compared to DC or BC alone (left panels) or compared to BC control (right panels) and unpaired t-test compared to DC control (right panels) except where indicated by horizontal lines.

