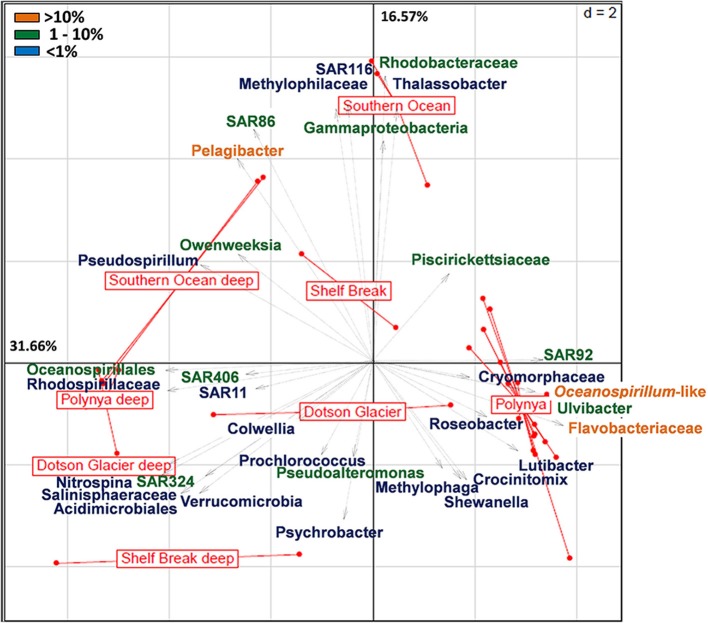
Figure 2.
Principal component analysis (euclidean distance) of the relative distribution of the 36 most abundant bacterial taxa across high throughput sequencing datasets from the Southern Ocean (Antarctic Circumpolar Current) and the Amundsen Sea (shelf break, Dotson glacier and polynya). The latter includes surface and deep bacterial communities sampled at the outer rim of the polynya, near the Dotson Glacier and in the open waters of the polynya. Pyrosequencing datasets of the Amundsen Sea polynya representing the 0.2–3 μm size fraction sampled during the 2007–2008 bloom event (4 surface and 3 deep samples; see Table S1) were included in the analysis. Orange labels denote taxa that contribute >10% of the bacterial community; green denotes 1–10%; Blue is <1%.

