Figure 6.
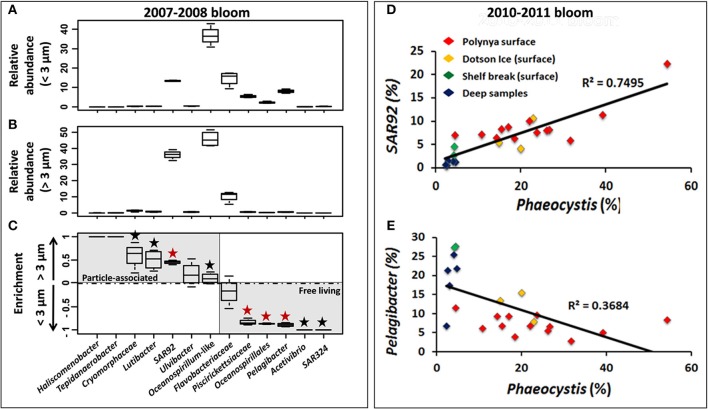
Relative abundance of 13 bacterial taxa in the <3 μm (A) and >3 μm (B) size fractions and preferential enrichment (C) of these taxa in either fraction among Phaeocystis bloom samples from surface waters in the Amundsen Sea polynya in 2007–2008. ANOVA test was performed using STAMP software to test the significance of their enrichment in the two size fractions. For each taxa, a black “★” symbol was added when p-value score was lower than 0.05 (>95% confidence level). This symbol displayed in red indicates a p < 0.01 (>99% confidence level). Correlation between Phaeocystis genotypes (percentage of the whole community) and SAR92 (D) or Pelagibacter (E) (percentage of the bacterial community) are displayed across all datasets during the Phaeocystis bloom of 2010–2011.

