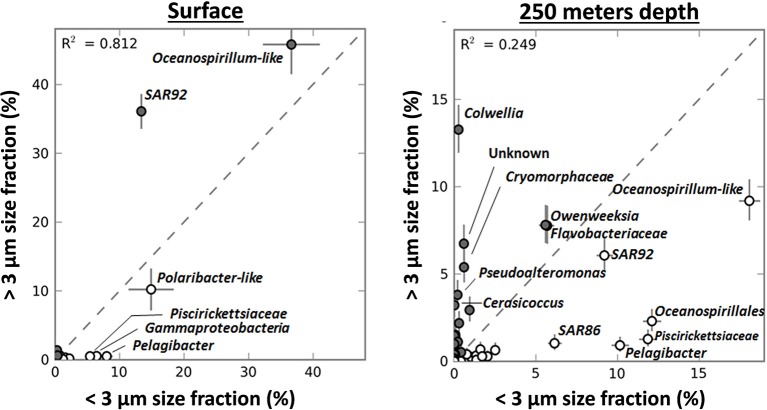
Figure 7.
The relative distribution in percentage of genera (based on GAST classification and using STAMP software) in the <3 μm and >3 μm size fractions in samples from surface layers (n = 8) and from 250 m depth (n = 2) during the Phaeocystis bloom in 2007–2008. The coloring of circles reflects the enrichment of the taxa (closed circles when more abundant in the >3 μm size fraction, open circles when more abundant in the <3 μm size fraction).

