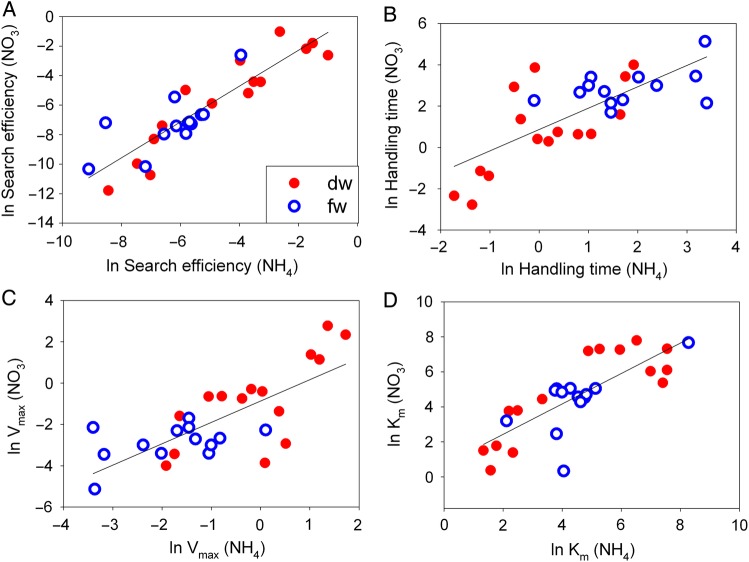
Figure 2.
Scatter plots and linear regressions of the observed relationship between (A) the search time for nitrate and ammonium (F1,26 = 100.4, P < 0.0001, R2 = 0.79), (B) the handling time for nitrate and ammonium (F1,26 = 31.2, P < 0.0001, R2 = 0.53), (C) Vmax for nitrate and ammonium (F1,26 = 31.2, P < 0.0001, R2 = 0.53) and (D) Km for nitrate and ammonium (F1,26 = 43.2, P < 0.0001, R2 = 0.61). Fresh (fw) and dry (dw) weights are plotted separately, but the patterns were qualitatively similar and so they were pooled for regression fits. Data were ln(x + 1) transformed.

