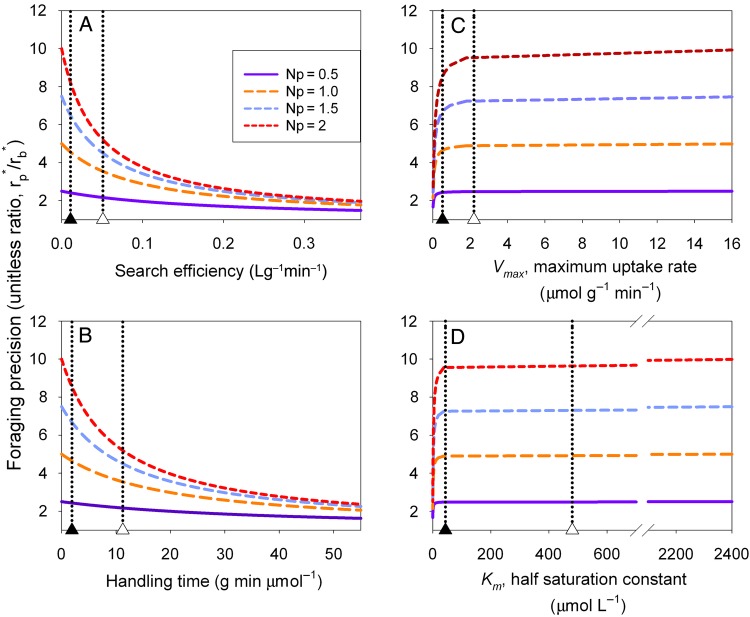
Figure 4.
Predicted root foraging precision over the observed range of search efficiency (A), handling time (B), maximum uptake rate (C) and half saturation constant (D) among plants. In each case the value of the background soil was Nb = 0.2 µmol L−1, and the value of the patch associated with each curve is shown in the figure legend (0.5 µmol L−1 < Np < 2 µmol L−1). In each panel, the x-axis parameter was varied, while the second parameter was held constant at the mean observed value for nitrate calculated from dry weight (Table 2). In each panel, the mean (open triangle) and median (closed triangle) observed values of parameters are indicated by dotted vertical lines.

