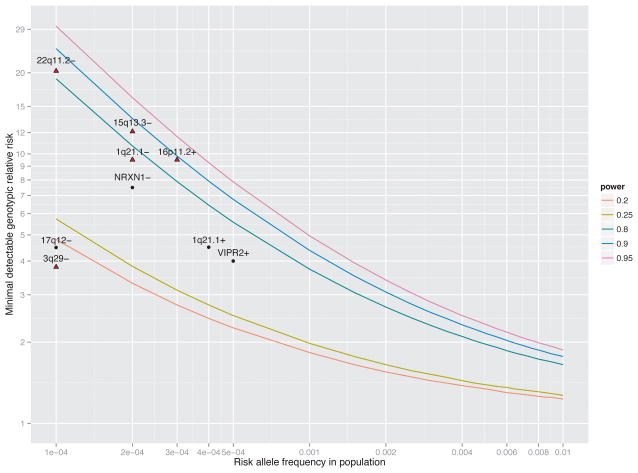
Figure 1.
Power to detect novel and known risk loci. The three solid lines depict the minimal detectable genotypic relative risk (y-axis) as a function of the risk allele frequency in the population (x-axis) to achieve 20%, 25%, 80%, 90%, and 95% power. Assumptions were 4,719 cases/5,917 controls, a dominant model, lifetime risk of schizophrenia of 0.7%, and α = 0.05. An additive model produced nearly identical results. Nine known CNVs associated with schizophrenia are shown as red diamonds (P < 0.05 in this study) or black dots (not detected). For each risk locus, the estimated OR and allele frequency in controls were obtained from the literature. If not found in controls, allele frequencies were set to 0.0001. The four most replicated loci (22q11.2−, 15q13.3−, 1q21.1, and 16p11.2+) can be detected given our sample size. Loci 17q12−, 3q29−, 1q21.1+, and VIPR2+ likely have imprecise estimates of GRR or frequency as evidenced in large discrepancies between various reports.

