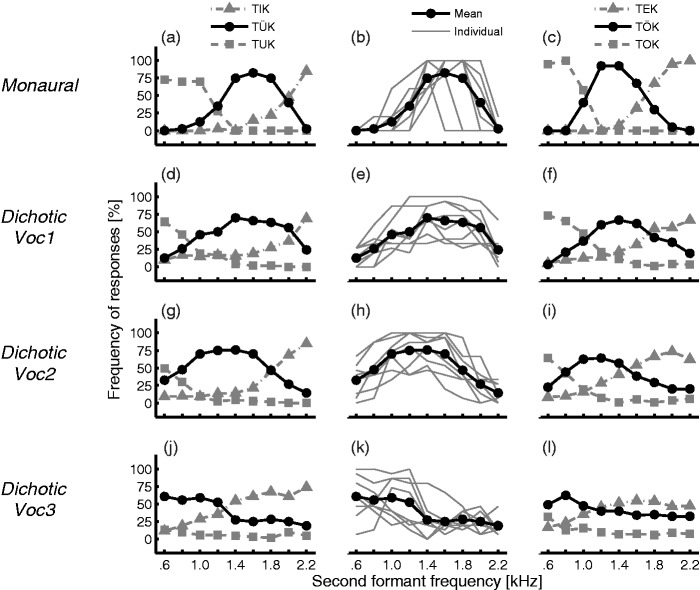
Figure 2.
Mean (N = 8) and individual results of the categorization test for the NH listeners. The number of occurrences (in %) is indicated for each vowel as a function of the frequency of F2. For the monaural condition, only five repetitions of the stimuli were presented, whereas 15 repetitions were used for the dichotic condition. Left column (a, d, g, and j): Mean results with F1 fixed at 250 Hz; therefore, only the occurrence of the choices TUK, TÜK, and TIK is shown. Middle column (b, e, h, and k): Individual results (gray lines) when F1 is fixed at 250 Hz, for the mid-F2 vowel TÜK. The mean is also shown in black. Right column (c, f, i, and l): Mean results when F1 is fixed at 400 Hz; therefore, only the occurrence of the choices TOK, TÖK, and TEK is shown. First row (a–c): Monaural condition, F1 and F2 are presented in the left channel. Second row (d–f): Dichotic condition, F1 is presented in the left channel while F2 is in the right channel, being processed with an unshifted vocoder (Voc1). Third row (g–i): Dichotic condition but with a vocoder slightly shifted (Voc2). Fourth row (j–l): Dichotic condition with a vocoder more pronouncedly shifted (Voc3). It can be seen with the mid-F2 vowel distribution (black circles) that the distribution is shifting toward the left, due to the simulated shift of the vocoder.

