Figure 13.

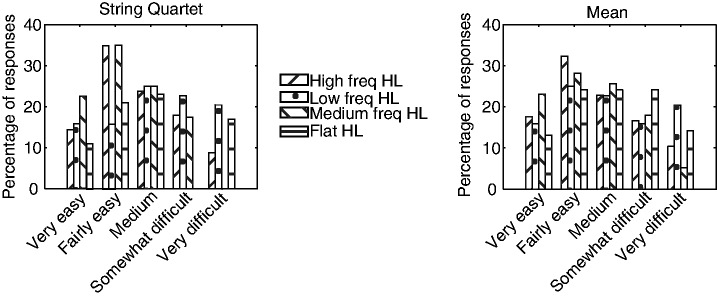
Percentage of responses for Question 21 for groups with different patterns of hearing loss. The left panel shows the responses for the string quartet and the right panel shows the mean responses across the 13 music types.

Percentage of responses for Question 21 for groups with different patterns of hearing loss. The left panel shows the responses for the string quartet and the right panel shows the mean responses across the 13 music types.