
Figure 3.
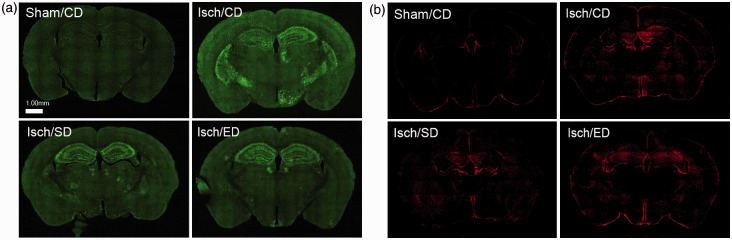
Brain sections immunostained with Iba-1 and GFAP.
Microphotographs were generated by fluorescent microscope at resolution of 40× magnification for entire section regions, followed by automatic stitching of borders. (a) Representative brain fluorescent microscopic images of Iba-1 expression in the sham-operated mice with the control diet (Sham/CD), and the ischemic animals with the control diet (Isch/CD), Sutherlandia diet (Isch/SD), and elderberry diet (Isch/ED). (b) Representative whole-brain fluorescent microscopic images of GFAP expression in the sham-operated mice with the control diet (Sham/CD), and the ischemic animals with the control diet (Isch/CD), Sutherlandia diet (Isch/SD), and elderberry diet (Isch/ED). Scale bar = 1.00 mm in (a) and (b).