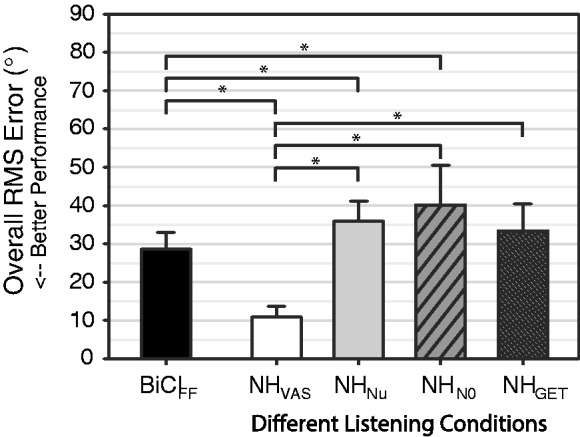
Figure 1.

Summary of localization performance. The average RMS error (bars, mean) and standard deviation (error bars, ±SD) for NH and BiCI subjects are plotted. The asterisk indicates statistically significant results for comparison of the average RMS across subjects for each listening condition and post hoc analysis (see text for details).
