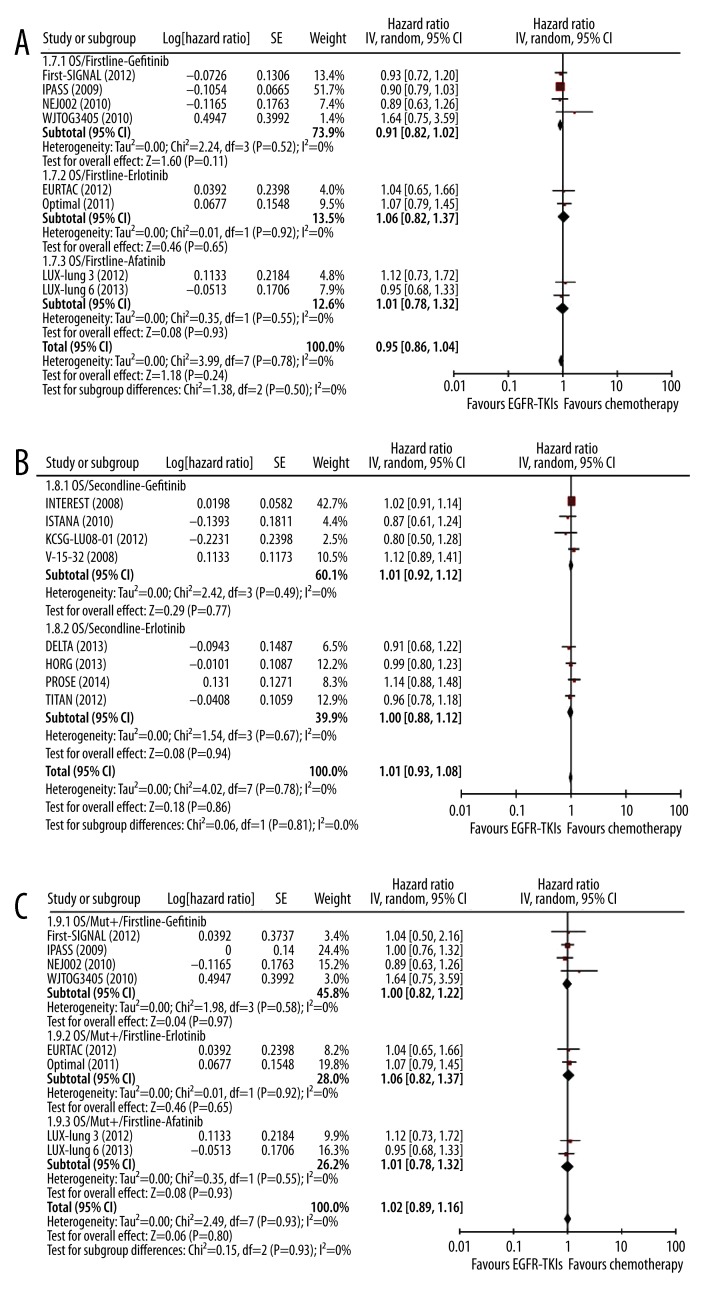
Figure 3A–C.
Meta-analysis of the effect of EGFR-TKIs on OS in first-line and second-line settings. Comparison of the effect on OS between EGFR-TKIs and chemotherapy in first-line setting (A) and in second-line setting (B); Comparison of the effect on OS in mut+ patients in first-line setting (C) and in second-line setting (D); Comparison of the effect on OS in mut− patients in first-line setting (E) and in second-line setting (F).

