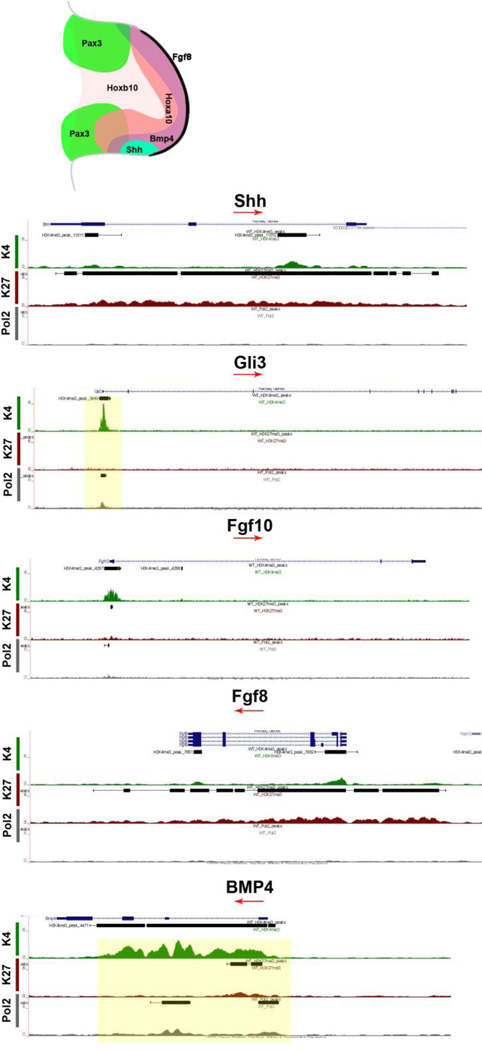
Figure 3. Chromatin State of Signaling Molecules.
Cartoon illustrates the expression profile of key regulators of limb patterning and cell specification at E12.5, including signaling molecules Fgf8, Shh and BMP4 and SSTFs Hoxb10, Hoxa10 and Pax3. Black bars above peaks indicate the “called peaks” as determined with MACS 2.0. Thick bar segments are subpeaks, with adjoining lines indicating a merge of subpeaks that makes up a marked region. Shh and Fgf8 are bivalently marked, while Fgf10 was marked for H3K4me3. Gli3 and BMP4 were actively transcribed.

