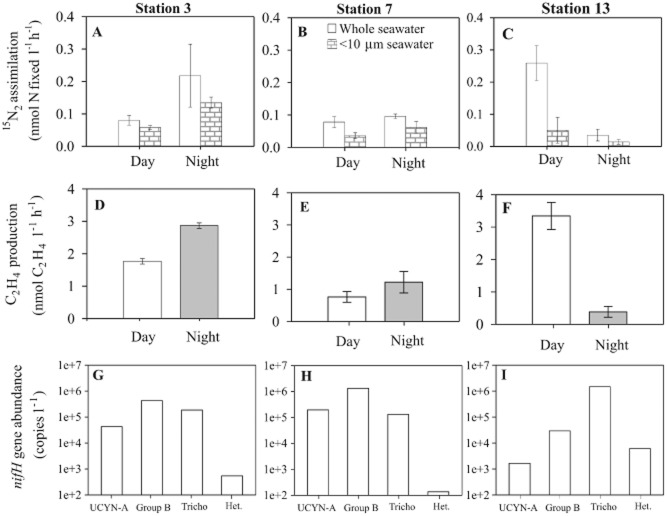
Fig 2.
N2 fixation rates as measured by (A–C) 15N2 tracer assimilation and (D–F) the AR assay for seawater samples collected at 25 m and incubated onboard the ship during either the day or night period. Post-incubation size fractionation was conducted for replicate 15N2 tracer additions and not for the AR assay. The error bars in A–F represent standard error (n = 3). The nifH gene abundances collected from the same depth on the same date are shown for UCYN-A, Group B (Crocosphaera spp.), (Tricho) Trichodesmium and (Het) heterocystous cyanobacteria (G–I).

