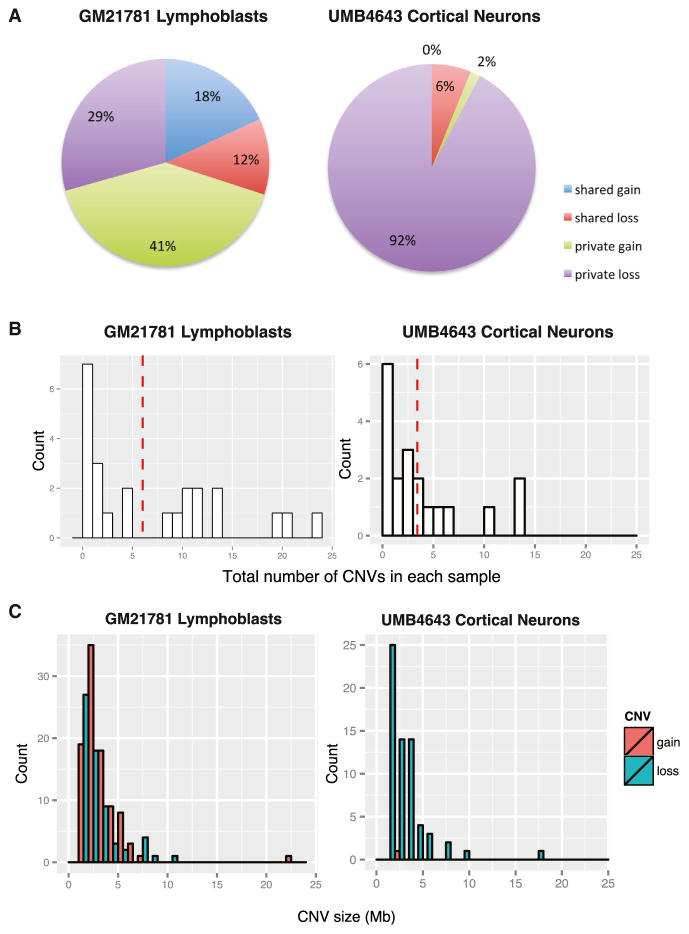
Figure 4. Comparative CNV Landscape in Lymphoblasts and Cortical Neurons.
(A) Pie chart summarizes CNVs identified from single lymphoblasts versus single neurons. Approximately 30% (18% CN gains and 12% losses) of CNVs identified from single lymphoblasts are clonal, whereas only 6% (6% CN losses and 0% gain) of CNVs identified from single neurons are clonal. CNVs identified from single neurons are predominately private losses, whereas CNVs identified from single lymphoblasts are balanced between losses and gains.
(B) Histogram of total candidate CNVs identified in each single cell. Left: histogram of CNVs identified in each single lymphoblast (n = 24) shows that most single cells harbor less than five CNVs, though three outlier cells show larger numbers. The red dashed line shows the average CNVs per lymphoblast (6.7). Right: histogram of CNVs identified in each single neuron (n = 19), showing that most single neurons harbor less than five CNVs, with three outliers showing larger numbers. The red dashed line represents the average number of CNVs per neuron at 3.4.
(C) Size distribution of CNVs identified from single cells. Left: size distribution of all CNVs identified in single lymphoblasts (n = 160). Most are less than 5 Mb with one outlier at 22 Mb, without obvious differences in size distribution between losses (green bars) and gains (red bars). Right: size distribution of CNVs identified in single neurons (n = 65). Most are <5 Mb with one outlier at 18 Mb. The only gain (red bar) identified is on the small end of the size distribution.

