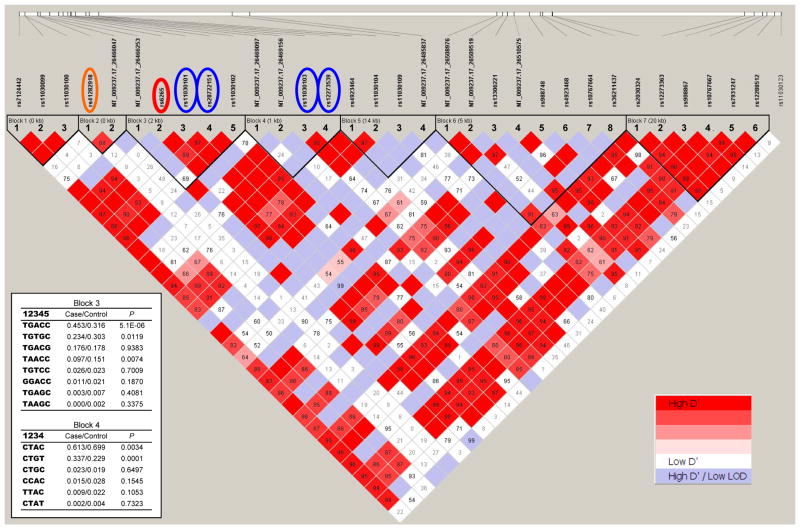
Figure 1. Linkage disequilibrium (LD) pattern in BDNF.
Standard color scheme in Haploview program is used to display the level of logarithm of odds (LOD) and the D′ (right inserted key). Estimated statistics of the D′ are shown in each box. They indicate the LD relationship between each pair of SNPs and they are not labeled if D′=1.00. The BDNF gene structure is illustrated by a long horizontal white bar with vertical lines indicating the relative positions of SNPs and black box representing alternative exons named by Pruunsild et al7. SNPs associated with depression are marked in orange (UTR), red (coding) and blue (intronic) circles. Left inset shows haplotype frequencies in cases and controls and the p values for the association analysis between haplotype and diagnosis of depression in blocks 3 and 4.

